Configuring prometheus-operator helm chart with AWS EKS

Platform Tech Lead at Zolo, Writes Engineering Blogs, Editor at NerdVolume, OpsDev, and Philosophy junkie.
Prometheus is a popular open-source monitoring and alerting tool, especially used in the Kubernetes environment. There are a lot of articles out there that explain the amazing features of Prometheus so the objective of this article would be to help everyone figure out how to configure the prometheus-operator helm chart which seems to have rather complex documentation for beginners.
First of all, you can find the prometheus-operator helm chart.
For the past few weeks, the maintainers of the Github repo kept improving the documentation. These improvements include some of the hard-learned ways of configuring the helm chart as well as few more tricks which we had to work very hard to figure out. Even after you figure out a way to configure it, EKS has weird issues with this specific helm chart which requires an additional custom configuration.
In order to install the helm chart to your cluster,
helm install stable/prometheus-operator --name prometheus-operator --namespace monitoring
This will create a namespace monitoring in your cluster and install the following.,
- Prometheus
- Grafana
- Alertmanager
This also adds node exporters that track data from your worker nodes and send them to Prometheus.
However, the story doesn’t end here. The config provided by default would be very basic. For example, the data stored in Prometheus is not persistent and ingress is not defined, to begin with. You would have to proxy the dashboards to access them.
When you search on the internet for how to configure the helm chart, you will find out that values.yaml file needs to be edited with the desired configuration.
The file can be found here.
Here are some of the things we configured which you might find useful.,
Alertmanager Config:
Alertmanager is used to forward the alerts triggered by Prometheus to alerting tools like Pagerduty. We at Zolo use Zenduty. If you don’t want to associate with any paid rules, you can always integrate with Slack. Find the Alertmanager configuration directives block in the values.yaml file and update it in the following fashion.
## Alertmanager configuration directives
## ref: https://prometheus.io/docs/alerting/configuration/#configuration-file
##      https://prometheus.io/webtools/alerting/routing-tree-editor/
##
config:
  global:
    resolve_timeout: 5m
  route:
    group_by: ['alertname']
    group_wait: 10s
    group_interval: 10s
    repeat_interval: 1h
    receiver: 'devops'
    routes:
    # suppress
    - match:
        alertname: Watchdog
      receiver: 'null'
    - match:
        deployment: 'backend'
      receiver: 'backend'
    - match_re:
        pod: '(backend.*)'
      receiver: 'backend'
    - match:
        deployment: 'frontend'
      receiver: 'frontend'
    - match_re:
        pod: '(frontend.*)'
      receiver: 'frontend'
  receivers:
    # suppress
    - name: 'null'
    # devops
    - name: 'devops'
      webhook_configs:
        - url: 'https://www.zenduty.com/api/integration/prometheus/<key>/'
    # backend
    - name: 'backend'
      webhook_configs:
        - url: 'https://www.zenduty.com/api/integration/prometheus/<key>/'
    # frontend
    - name: 'frontend'
      webhook_configs:
        - url: 'https://www.zenduty.com/api/integration/prometheus/<key>/'
  inhibit_rules:
    - source_match:
        severity: 'critical'
      target_match:
        severity: 'warning'
      equal: ['alertname', 'dev', 'instance']
All alerts by default go to DevOps receiver. Only frontend pod alerts go to frontend receiver, just like backend pod alerts go to backend receiver. Each receiver is configured with a unique webhook. These webhooks trigger SMS and a phone call to the concerned on-call developer based on the configuration provided. These alerting tools are pretty intuitive with great support and configuring them with escalation policies is a piece of cake.
Alertmanager Ingress:
If you don’t want to proxy the Alertmanager dashboard over localhost every time, you can configure ingress like below.,
ingress:
  enabled: true
  annotations: {
    kubernetes.io/ingress.class: "nginx",
    nginx.ingress.kubernetes.io/whitelist-source-range: "172.16.254.1"
  }
  labels: {}
  ## Hosts must be provided if Ingress is enabled.
  ##
  hosts:
   - alertmanager.example.com
  ## Paths to use for ingress rules - one path should match the alertmanagerSpec.routePrefix
  ##
  paths:
   - /
This ensures the domain alertmanager.example.com is only available at the given IP addresses. This is necessary as there is no inherent authentication mechanism in place. The ingress for this follows standard Nginx based Kubernetes Ingress.
Additional Prometheus Rules:
Prometheus by default comes with a lot of useful rules which basically trigger alerts when those rules are breached. But these are a bare minimum. After researching a few SRE articles on the web, I found the following links extremely useful., Awesome Prometheus Alerts Monitoring Distributed Systems How to monitor Golden signals in Kubernetes.
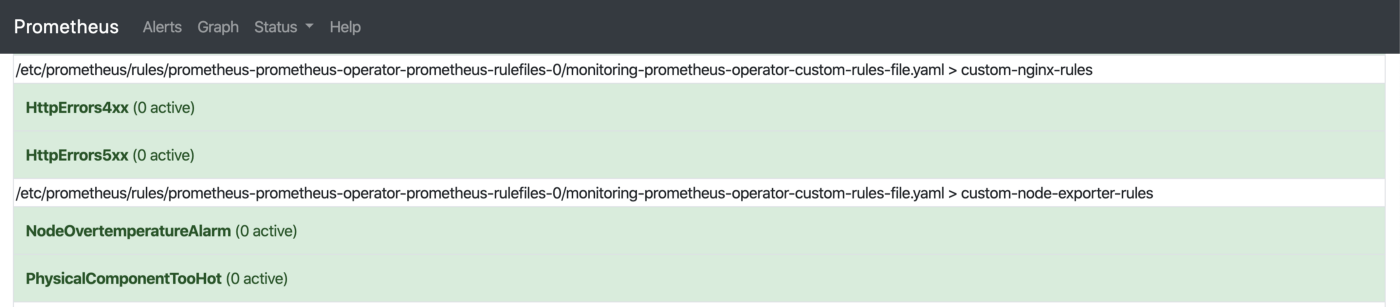
In order to add the custom rules to the existing Prometheus configuration, make the changes in the additionalPrometheusRules block.
## Provide custom recording or alerting rules to be deployed into the cluster.
##
additionalPrometheusRules:
  - name: custom-rules-file
    groups:
      - name: custom-node-exporter-rules
        rules:
          - alert: PhysicalComponentTooHot
            expr: node_hwmon_temp_celsius > 75
            for: 5m
            labels:
              severity: warning
            annotations:
              summary: "Physical component too hot (instance {{ $labels.instance }})"
              description: "Physical hardware component too hot\n  VALUE = {{ $value }}\n  LABELS: {{ $labels }}"
          - alert: NodeOvertemperatureAlarm
            expr: node_hwmon_temp_alarm == 1
            for: 5m
            labels:
              severity: critical
            annotations:
              summary: "Node overtemperature alarm (instance {{ $labels.instance }})"
              description: "Physical node temperature alarm triggered\n  VALUE = {{ $value }}\n  LABELS: {{ $labels }}"
For example, the above block fires the alerts when physical components get too hot.
Grafana Ingress:
Grafana is an open-source monitoring and analytics solution. This has deep integration with Prometheus and provides predefined dashboards which are really helpful.
To access Grafana over custom domain update the ingress config.,
ingress:
  ## If true, Grafana Ingress will be created
  ##
  enabled: true
  ## Annotations for Grafana Ingress
  ##
  annotations: {
    kubernetes.io/ingress.class: "nginx",
    nginx.ingress.kubernetes.io/whitelist-source-range: "172.16.254.1"
  }
    # kubernetes.io/ingress.class: nginx
  # kubernetes.io/tls-acme: "true"
  ## Labels to be added to the Ingress
  ##
  labels: {}
  ## Hostnames.
  ## Must be provided if Ingress is enable.
  ##
  # hosts:
  #   - grafana.domain.com
  hosts:
    - grafana.example.com
  ## Path for grafana ingress
  path: /
According to the above config, the Grafana dashboard will be accessible through grafana.example.com through the mentioned IP addresses. Grafana has an authentication system, so you can choose to make it public.
Prometheus Ingress:
Just like Alertmanager and Grafana, the Prometheus dashboard can also be accessed through a custom domain.,
ingress:
  enabled: true
  annotations: {
    kubernetes.io/ingress.class: "nginx",
    nginx.ingress.kubernetes.io/whitelist-source-range: "172.16.254.1"
  }
  labels: {}
  ## Hostnames.
  ## Must be provided if Ingress is enabled.
  ##
  # hosts:
  #   - prometheus.domain.com
  hosts:
    - prometheus.example.com
  ## Paths to use for ingress rules - one path should match the prometheusSpec.routePr
  ##
  paths:
    - /
Scrape & Evaluation Interval:
You can update the scrape and evaluation interval by updating the prometheusSpec block.,
## Settings affecting prometheusSpec
## ref: https://github.com/coreos/prometheus-operator/blob/master/Documentation/api.md#prometheusspec
##
prometheusSpec:
  ## Interval between consecutive scrapes.
  ##
  scrapeInterval: 15s
  ## Interval between consecutive evaluations.
  ##
  evaluationInterval: 15s
Persistent Volume for Prometheus:
By default, Prometheus uses the volume provided by the worker nodes to store the data. But we can configure it to use persistent volume to ensure data is not lost even when Prometheus goes down or restarts.,
## Prometheus StorageSpec for persistent data
## ref: https://github.com/coreos/prometheus-operator/blob/master/Documentation/user-guides/storage.md
##
storageSpec:
  volumeClaimTemplate:
    spec:
      storageClassName: gp2
      accessModes: ["ReadWriteOnce"]
      resources:
        requests:
          storage: 50Gi
Since we are using AWS, gp2 would be the storageClassName. Request the storage size as per your need.
EKS Specific Changes:
When you set up Prometheus using the default config, you will see a lot of alerts firing unnecessarily. For example, KubeScheduler is not down, KubeController is not responding, etc., This happens because the Prometheus Node Exporters are unable to get metrics from the services which are running on the control plane.
Here are the few alerts which we can disable in the values.yaml file.,
## Component scraping the kube controller manager
##
kubeControllerManager:
  enabled: false
## Component scraping kube scheduler
##
kubeScheduler:
  enabled: false
## Component scraping kube proxy
##
kubeProxy:
  enabled: false
Finally, in order to update the helm deployment, we run the following command.,
helm upgrade -f values.yaml prometheus-operator stable/prometheus-operator
If you are running the helm chart for the first time, you can also run the following command.,
helm install stable/prometheus-operator \
 — name prometheus-operator \
 — namespace monitoring -f values.yaml
These commands ensure the helm chart is configured with the custom changes added in the values.yaml file.
Cleaning Up:
Say you made a mistake and want to purge the whole deployment and restart, you would have to run the following command.,
#!/usr/bin/env bash
helm delete --purge prometheus-operator
kubectl delete namespace monitoring
kubectl delete crd alertmanagers.monitoring.coreos.com
kubectl delete crd podmonitors.monitoring.coreos.com
kubectl delete crd prometheuses.monitoring.coreos.com
kubectl delete crd prometheusrules.monitoring.coreos.com
kubectl delete crd servicemonitors.monitoring.coreos.com
As you can see, we are deleting a lot of CustomResourceDefinations. These should be deleted separately though they are created during the deployment of the helm chart.
If you are into DevOps or Fullstack and find terms like ServiceMesh, Infrastructure Automation, Event Loop and Micro-Frontends exciting as much as we do, then drop us a line at join-tech@zolostays.com. We would love to take you out for a Coffee ☕ to discuss the possibility of you working with us.
